- K-12 Education
-


-


-


Communicate with boards, teachers and parents for better conversations.
-
 Integrates with Google Analytics for deeper audience insights
 -
General-purpose Map visualization
-
OpenBook Project Explorer for capital budgets
-
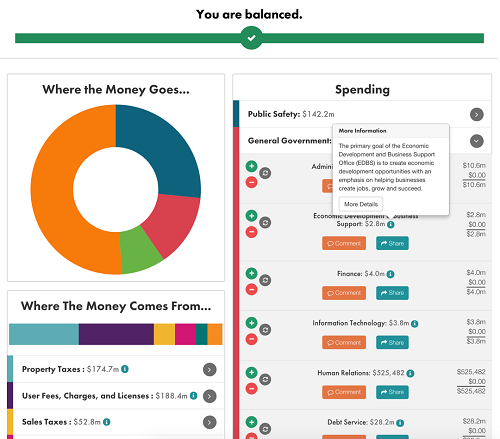
Integrates with Balancing Act's budget simulation tool
-
Import any data
-
Display data in interactive charts, tables, bars and graphs
-
Detailed information pop-ups and ability to zoom
-
Datasets, data sorting and filtering, plus subtotal grouping
-
Locally controlled data
-
Advanced search function
-
Access through any platform, including smartphones
-
Embed charts on any website
-
Share data through all social channels
-
Set-up in minutes, intuitive to use
-
Easily mastered with online training videos and guide tours
-
Seamlessly connect with Questica Budget
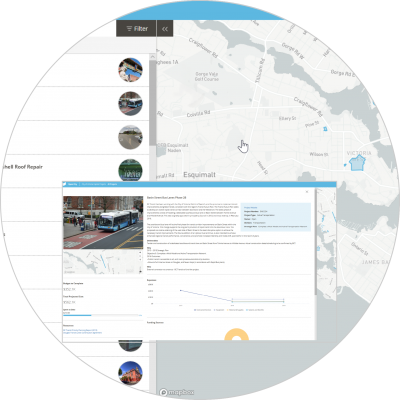
Project Explorer for Capital Budgets: Put all your capital projects (budget, images, docs, video) on an interactive map.
Sample data visualizations are available on our Open School website.
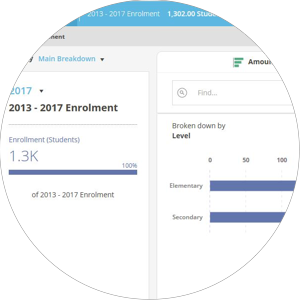
Drill down to a budget line item with our search, filter/sort options.
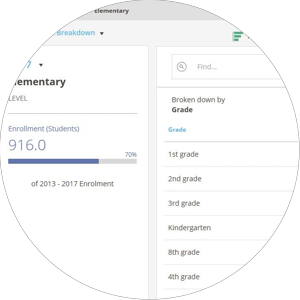
Quickly find what you are looking for with our built-in search.
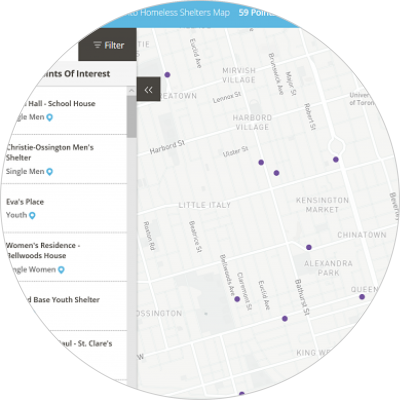
General map visualization can display any geographical, latitude/longitude points, geometry data on an interactive map.
WEBINAR
Connect with one of our K-12 School OpenBook experts.
Our team can show you how Questica OpenBook will help your school share and engage. Set up a personalized demo with one of our experienced team members or sign-up for one of our free information sessions. The next one’s on May 12, 2021.

Connect with one of our K-12 School OpenBook experts.
Our team can show you how Questica OpenBook will help your school share and engage. Set up a personalized demo with one of our experienced team members or sign-up for one of our free information sessions. The next one’s on May 12, 2021.