- Non-profit
-


-


-


Communicate with boards, donors, members and media for better conversations.
-
 Integrates with Google Analytics for deeper audience insights
 -
General-purpose Map visualization
-
Import any data
-
Display data in interactive charts, tables, bars and graphs
-
Datasets, data sorting and filtering, plus subtotal grouping
-
Detailed information pop-ups and ability to zoom
-
Access through any platform, including smartphones
-
Locally controlled data
-
Advanced search feature
-
Embed charts on any website
-
Share data through all social channels
-
Set-up in minutes, intuitive to use
-
Easily mastered with online training videos and guided tours
-
Integrates with Balancing Act's budget simulator tool
Sample data visualizations are available on our Open Non-profit website.
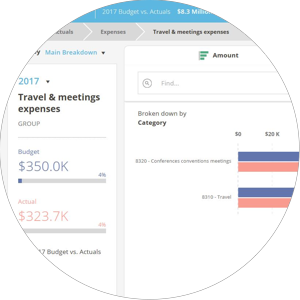
Drill down to a budget line item with our search, filter/sort options.
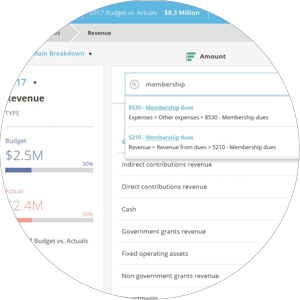
Quickly find what you are looking for with our built-in search.
Connect with one of our Non-profit OpenBook experts.
We’d be happy to show you how Questica Openbook can help your organization share and engage. Our team is full of energetic technology experts, budget professionals and business specialists that can set up a personalized demo or you can sign-up for one of our free information sessions. The next one’s on March 9, 2021.